
[tabs]
[tab title=’Intro’]
Intro
Science is about conveying knowledge, and that narrative can include image as well as textual representations. Thus, we are interested in Scientific Visualisation and Artwork in the context of academic journal articles (including cover artwork), papers, presentations, web content and teaching resources. Scientific Visualisation, may be defined as charts, diagrams and schematics that illustrate scientific data – often multidimensional and / or time variant data. Here the aim is to make trends and features of the data more discernible. Scientific Artworks, are diagrams and pictorial representations of scientific ideas, concepts and procedures that aim to inspire as well as inform. They are often referred to as infographics. Click on our Gallery tab to see some local productions.
[/tab]
[tab title=’Tools’]
Tools
Blender
Blender is a full featured 3D graphics and animation package which is able to render photo-realistic image scenes and animations. In the context of scientific artwork, Blender has the ability to import pdb files into a scene. A version of Blender tailored to scientific work is BioBlender.
Gimp
Gimp is an image manipulation software, similar to Photoshop. It supports working in layers, applying filters and adjusting image size and colour properties. Whilst it often primarily used to manipulate photos and other pre-existing images, it is sufficiently versatile to use as a digital artist platform, creating artworks from scratch.
Inkscape
Whereas Gimp operates on pixel based images, Inkscape operates on scalable vector graphics (.svg files), it therefore idea for 2D-graphic designs that need to be scalable to different sizes without loss of resolution.
Dia
Dia is an application designed to aid the production of any kind of connected chart; elements are linked together with connector or arrows, and these connection remain attached when the elements are moved around on the canvas. Idea for creating flow charts and organization charts.
ACD/ChemSketch
ChemSketch is a chemical drawing utility. This software can help create 2D chemical structure, using atoms, bonds and sub-structures that will be familiar to any chemist. The atomic arrangement can be ‘cleaned’ as well as converted into an “optimized” 3D structure. The 3D structures can be exported as mol files.
Avogadro
Avogadros is a molecular editor and designer. Although not as intuitive as ChemSketch, the software enable complex molecular structures to be designed and visualized. One feature that is highly useful is it’s ability to inter-convert many molecular file formats, mol, pdb etc.
ParaView
ParaView is an application for the visualization of 3D and time-varying numerical data; thus it is ideally suited to represent 2D and 3D scalar and vector fields; whether these be static or time-varying. It can be set up to run many session in parallel either on multi-core processor or across many computers. The parallelisation feature allow access to very large data sets (terabytes) or allow the rendering of highly complex visualizations.
Matlab
Matlab is primarily a tool for vector and matrix-base statistics and numerical computing. It also includes some very good tools for plotting and charting that are relatively intuitive to use. Although it is a fairly expensive commercial package, it is quite ubiquitous in academic environments where universities often have site licenses.
The R Project for Statistical Computing
Commonly referred to as R, The R Project for Statistical Computing is another package for carrying out vector and matrix-based numerical calculations; it too has a comprehensive set of plotting and charting tools, although with perhaps a steeper learning curve than Matlab, it never-the-less provides numerous charting options not available in Matlab.
Makehuman
Makehuman is an open source project that enables the easy creation of 3D human models that can be imported into a number of 3D graphics software, including Blender.
[/tab]
[tab title=’Gallery’]
Gallery

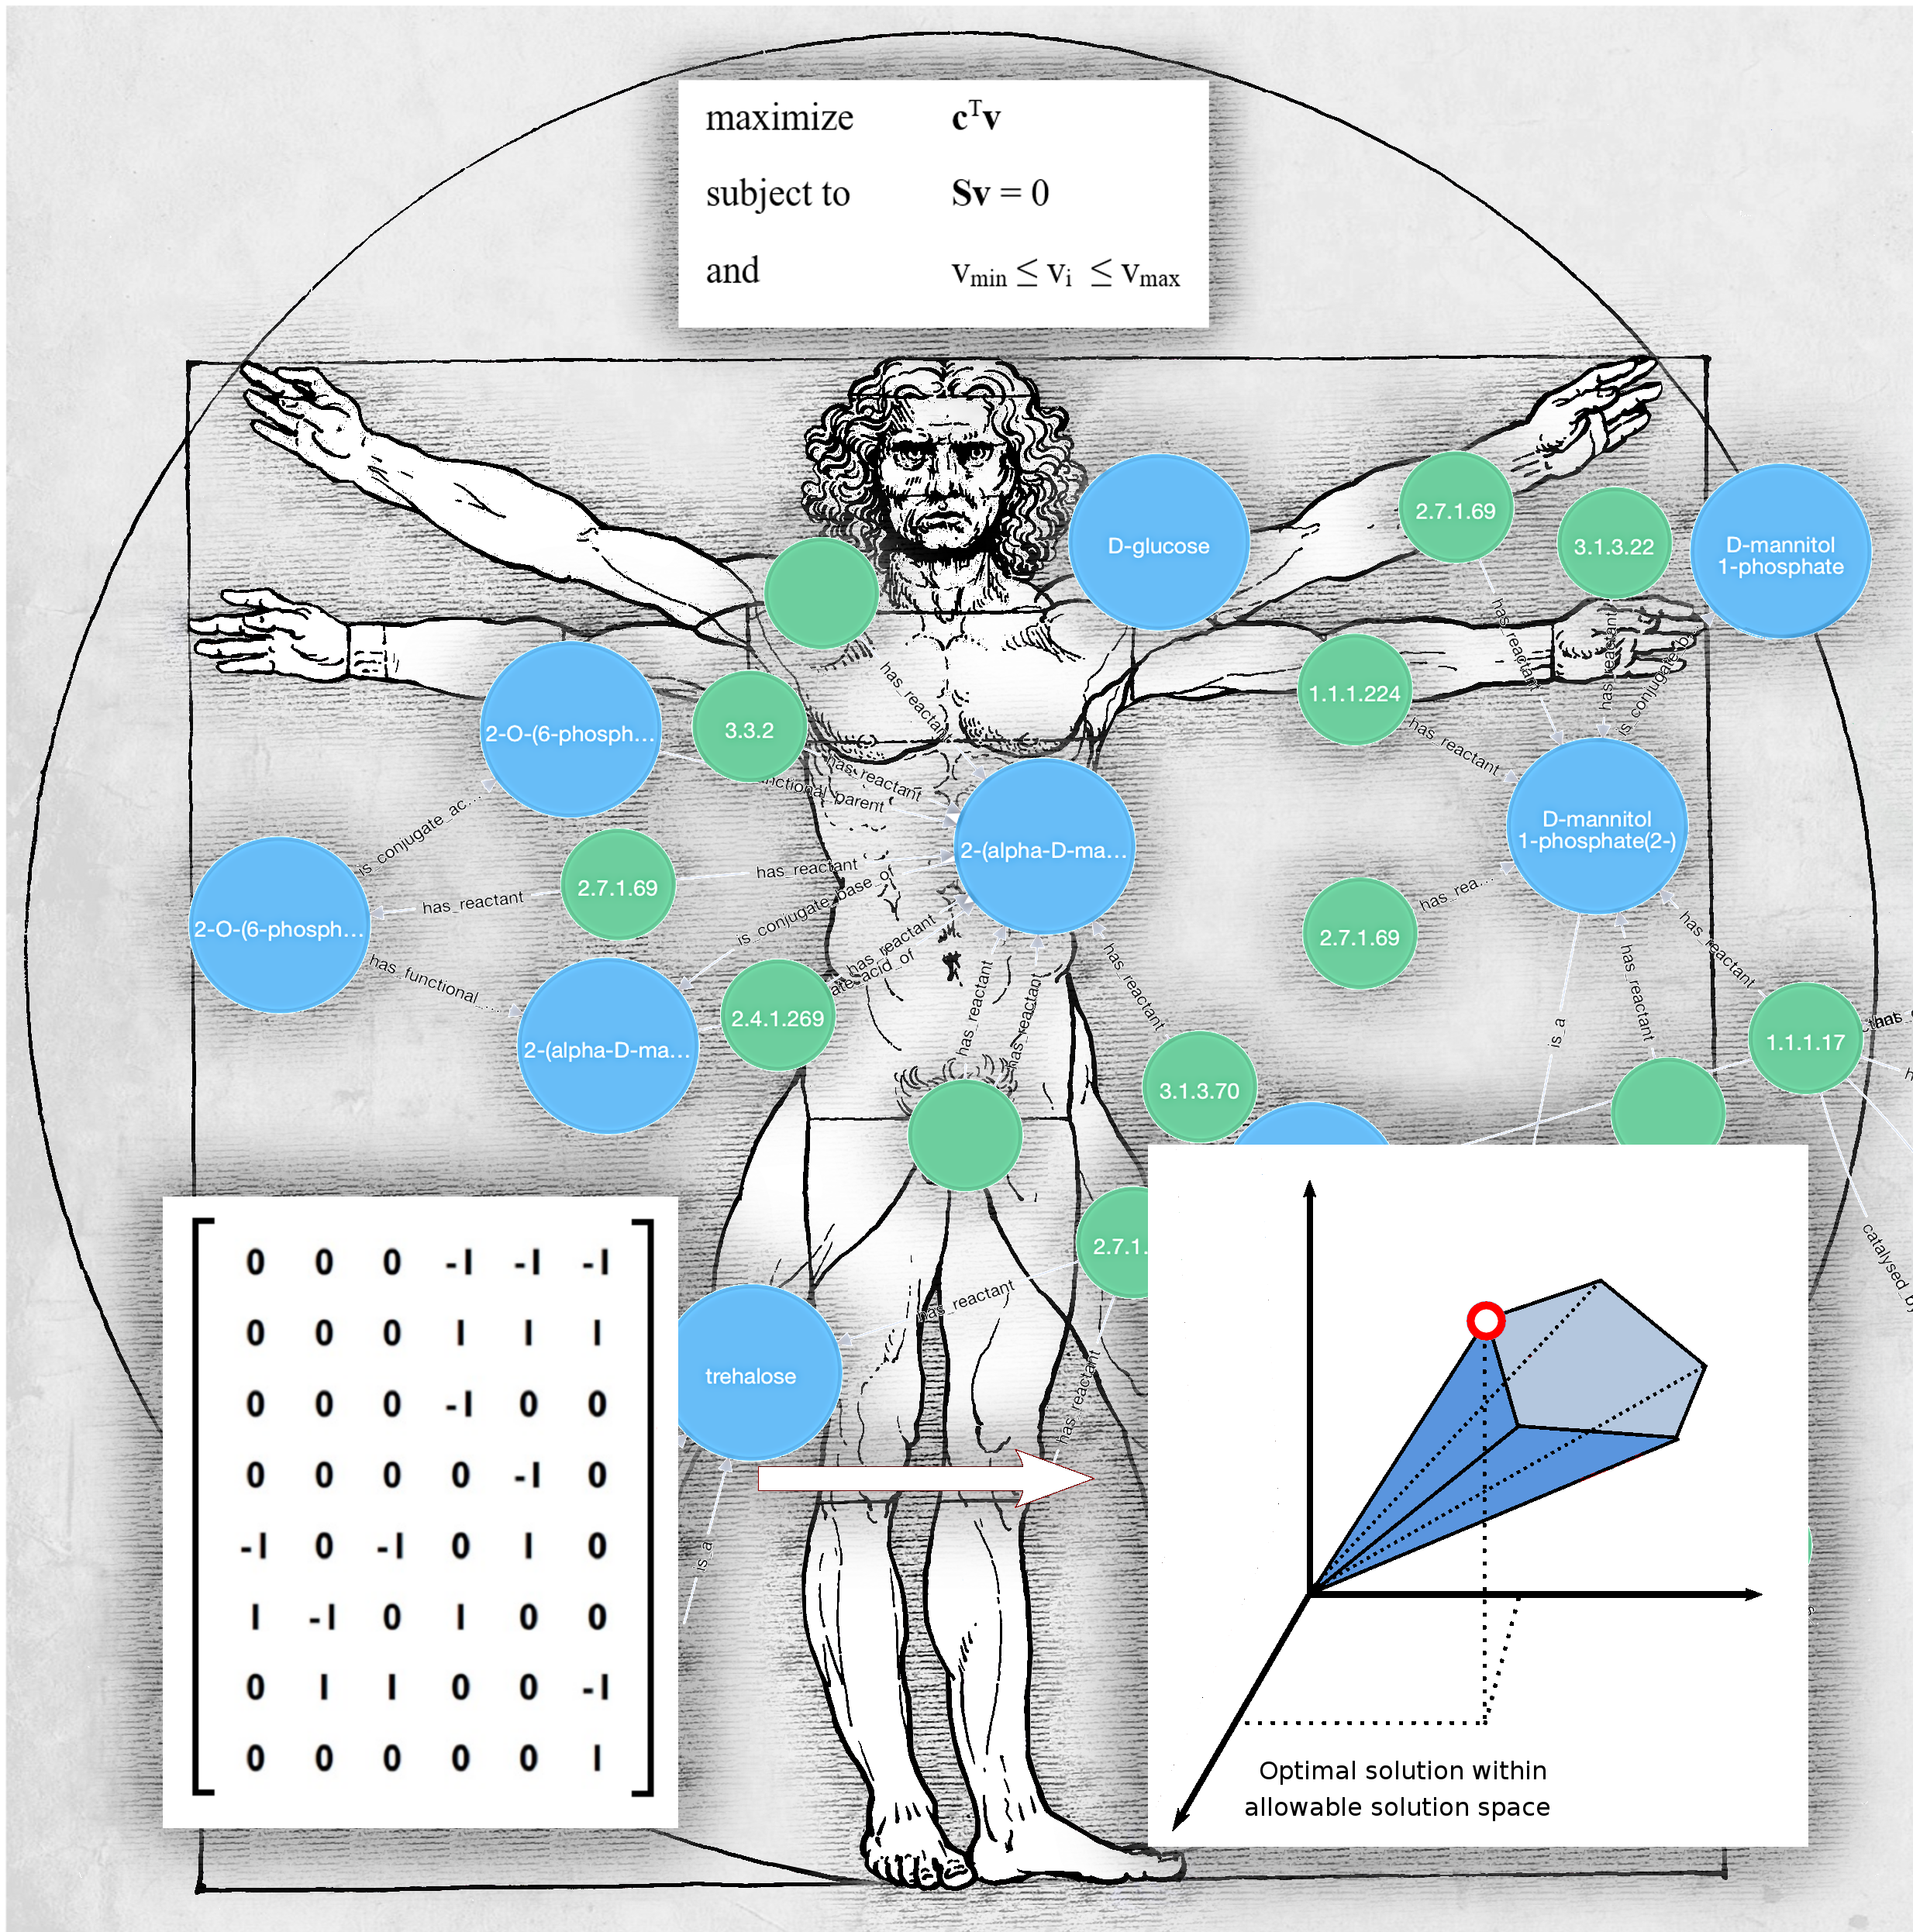
Metabolomics, 2017, Volume 13, Number 5. The front cover features the winner of the 2017 Best Review Award.
Metabolomics, 2017, Volume 13, Number 5. Front cover created using Inkscape and Gimp, incorporating a public domain image of Vitruvian Man & network images genered via biochem4j.
The front cover features the winner of the 2017 Best Review Award:
Swainston, N., Smallbone, K., Hefzi, H. et al. Metabolomics (2016). Recon 2.2: from reconstruction to model of human metabolism. 12: 109. doi:10.1007/s11306-016-1051-4

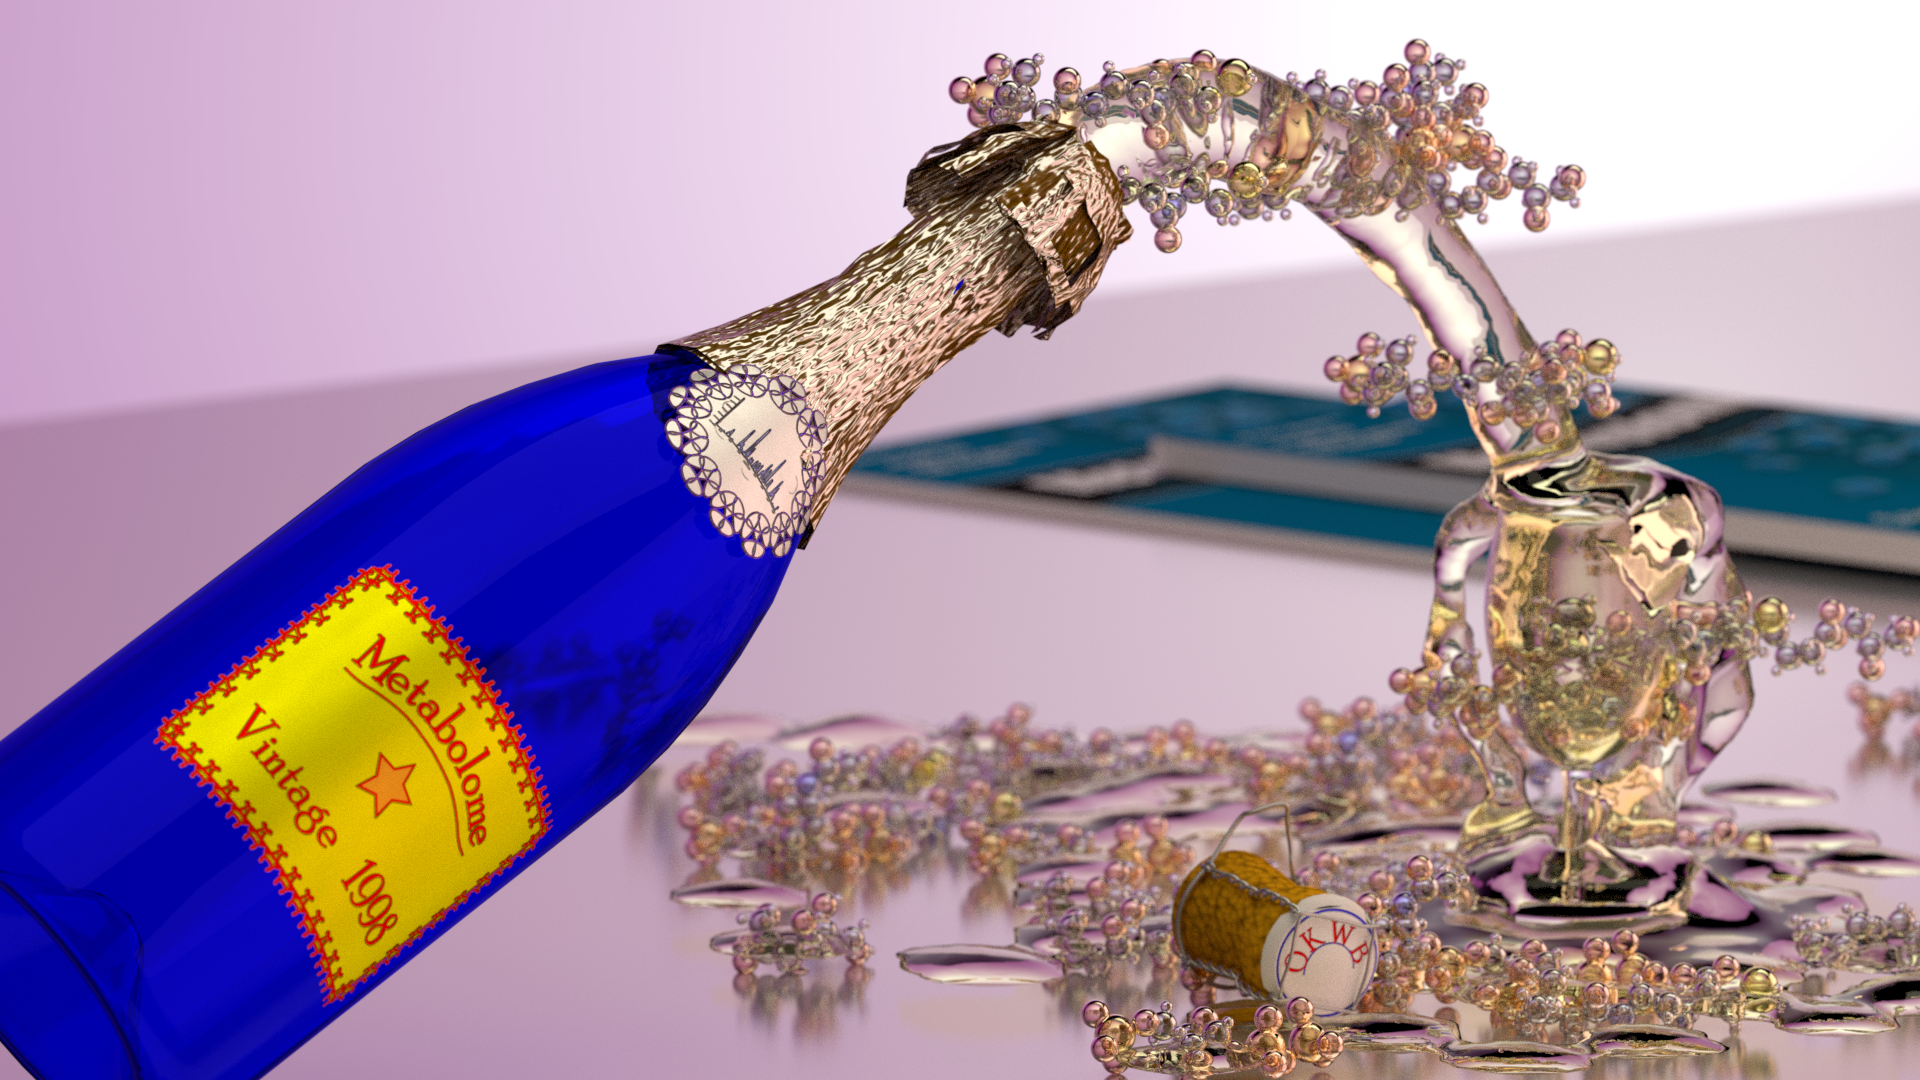
The metabolome 18 years on: a concept comes of age. Metabolomics, September 2016, Volume 12: Number 9.
Metabolomics, 2016, Volume 12, Number 9. Front cover created using Blender and Gimp.
Kell, D.B. & Oliver, S.G. (2016). The metabolome 18 years on: a concept comes of age. Metabolomics, 12, 148. pmid. DOI: 10.1007/s11306-016-1108-4.

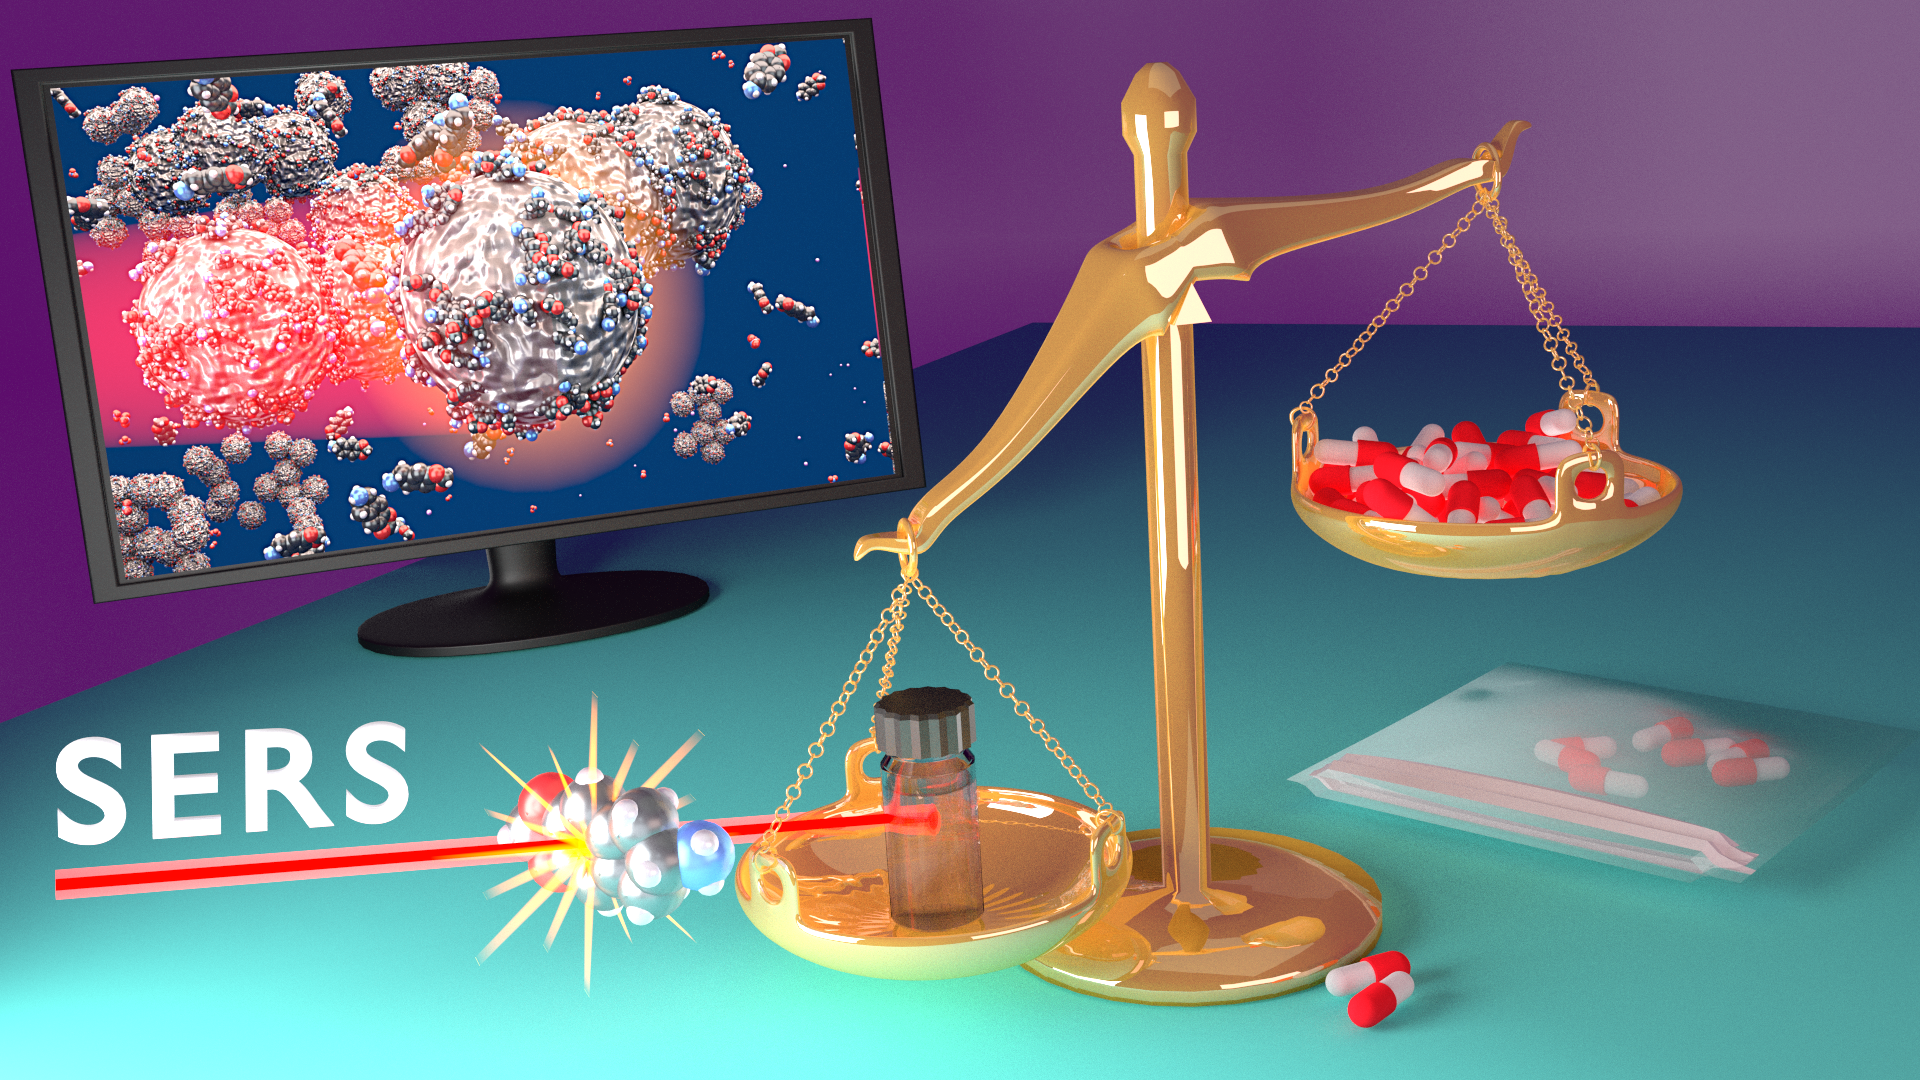
Application of Surface Enhanced Raman Scattering to the Solution Based Detection of a Popular Legal High, 5,6-methylenedioxy-2-aminoindane (MDAI). Analyst, 2015, Issue 13.
Analyst, 2015, Issue 13. Inside front cover created using Blender and Gimp.
Samuel Mabbott, Omar Alharbi, Kate Groves and Royston Goodacre (2015)
Application of Surface Enhanced Raman Scattering to the Solution Based Detection of a Popular Legal High, 5,6-methylenedioxy-2-aminoindane (MDAI). Analyst, 2015, Issue 13.
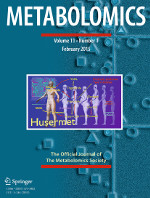
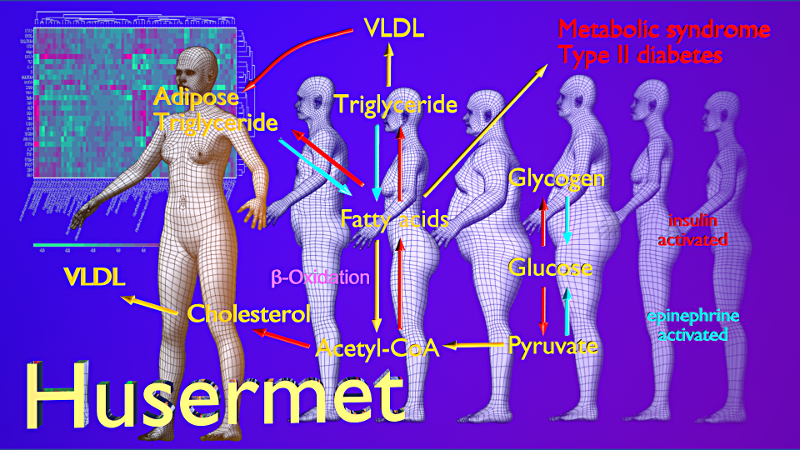
Molecular phenotyping of a UK population: defining the human serum metabolome. Metabolomics, 11(1), 9-26.
Metabolomics, Volume 11, number 1. Created using Blender, Gimp and Makehuman.
Dunn, W.B., Lin, W., Broadhurst, D., Begley, P., Brown, M., Zelena, E., Vaughn, A.A., Halsall, A., Harding, N., Knowles, J.D., Francis-McIntyre, S., Tseng, A., Ellis, D.I., O’Hagan, S., Aarons, G., Boben, B., Chew-Graham, S., Moseley, C., Potter, P., Winder, C.L., Potts, C., Thornton, P., McWhirter, C., Zubair, M., Pan, M., Burns, A., Cruickshank, J.K., Jayson, G.C., Purandare, N., Wu, F.C.W., Finn, J.D., Haselden, J.N., Nicholls, A.W., Wilson, I.D., Goodacre, R., Kell, D.B. (2015) Molecular phenotyping of a UK population: defining the human serum metabolome. Metabolomics, 11(1), 9-26. doi:10.1007/s11306-014-0707-1
Images © Dr. Steve O’Hagan & Bioanalytical Sciences Group; copyright of journal covers is with the respective journals.

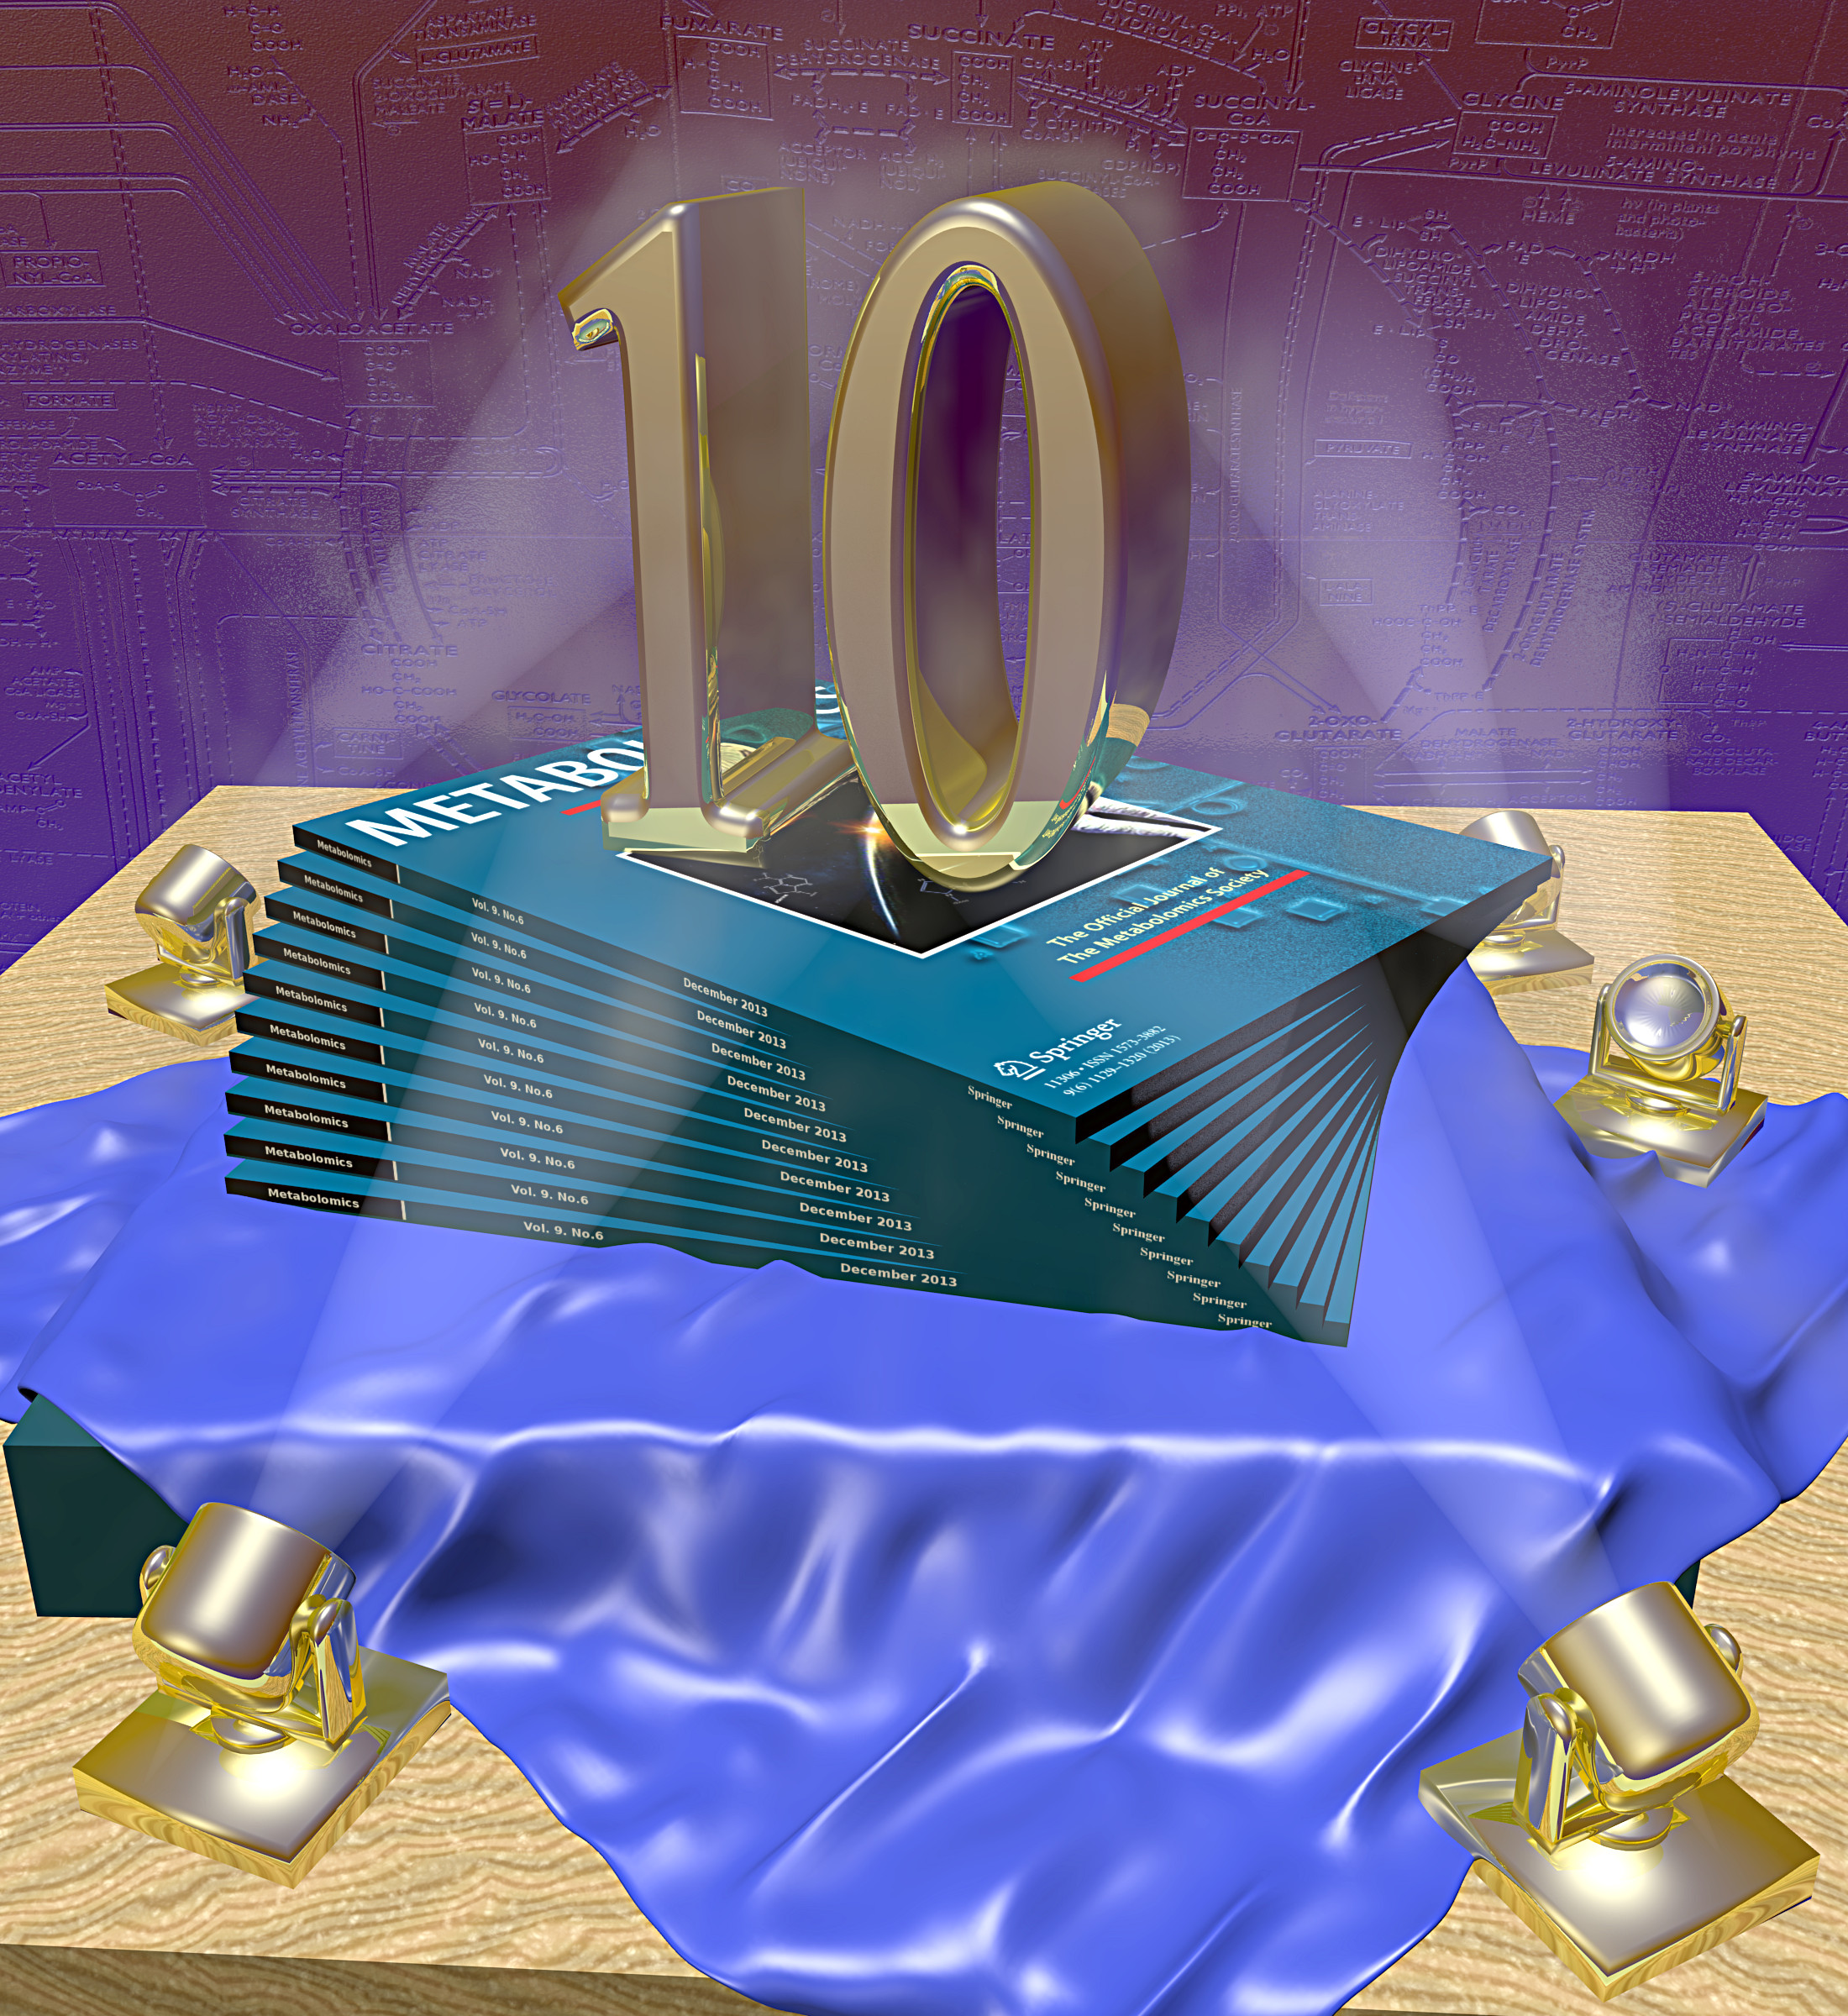
Metabolomics Vol. 10, No.1: Tenth Anniversary Cover.
Metabolomics 10, 1, front cover: 10th Anniversary Edition. Created using Blender and Gimp.
Images © Dr. Steve O’Hagan & Bioanalytical Sciences Group; copyright of journal covers is with the respective journals.

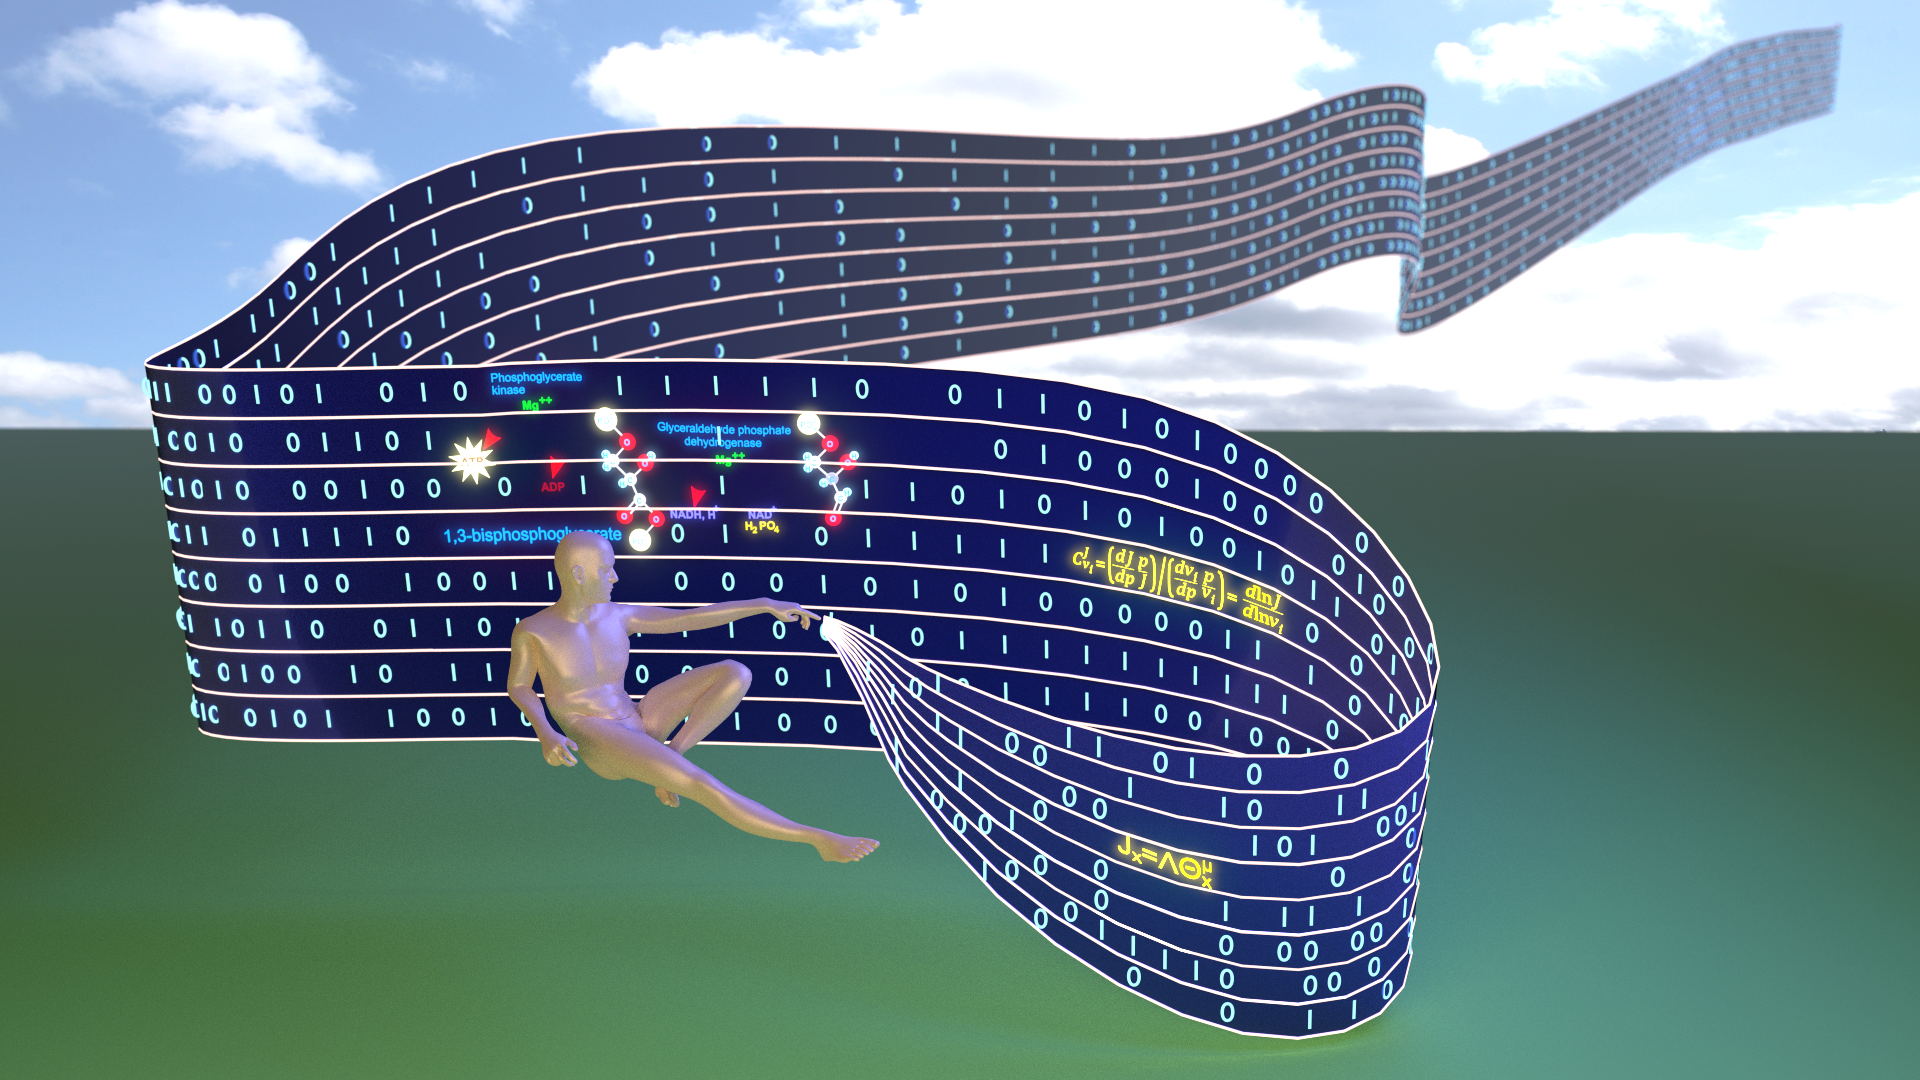
An analysis of a ‘community-driven’ reconstruction of the human metabolic network.
Metabolomics 9, 4, 757-764, front cover. Neil Swainston, Pedro Mendes & Douglas B. Kell. (2013) An analysis of a ‘community-driven’ reconstruction of the human metabolic network, Metabolomics, 9, 4, 757-764. Created using Blender, Makehuman and Gimp.
Images © Dr. Steve O’Hagan & Bioanalytical Sciences Group; copyright of journal covers is with the respective journals.
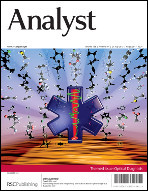
Illuminating disease and enlightening biomedicine: Raman spectroscopy as a diagnostic tool. Analyst, 138(14), 3871-3884
Analyst 138, 2871-3884, front cover. Ellis, D.I., Cowcher, D.P., Ashton, L., O’Hagan, S. & Goodacre, R. (2013) Illuminating disease and enlightening biomedicine: Raman spectroscopy as a diagnostic tool. Analyst 138, 2871-3884. Image Created using Blender and Gimp by Dr. Steve O’Hagan. 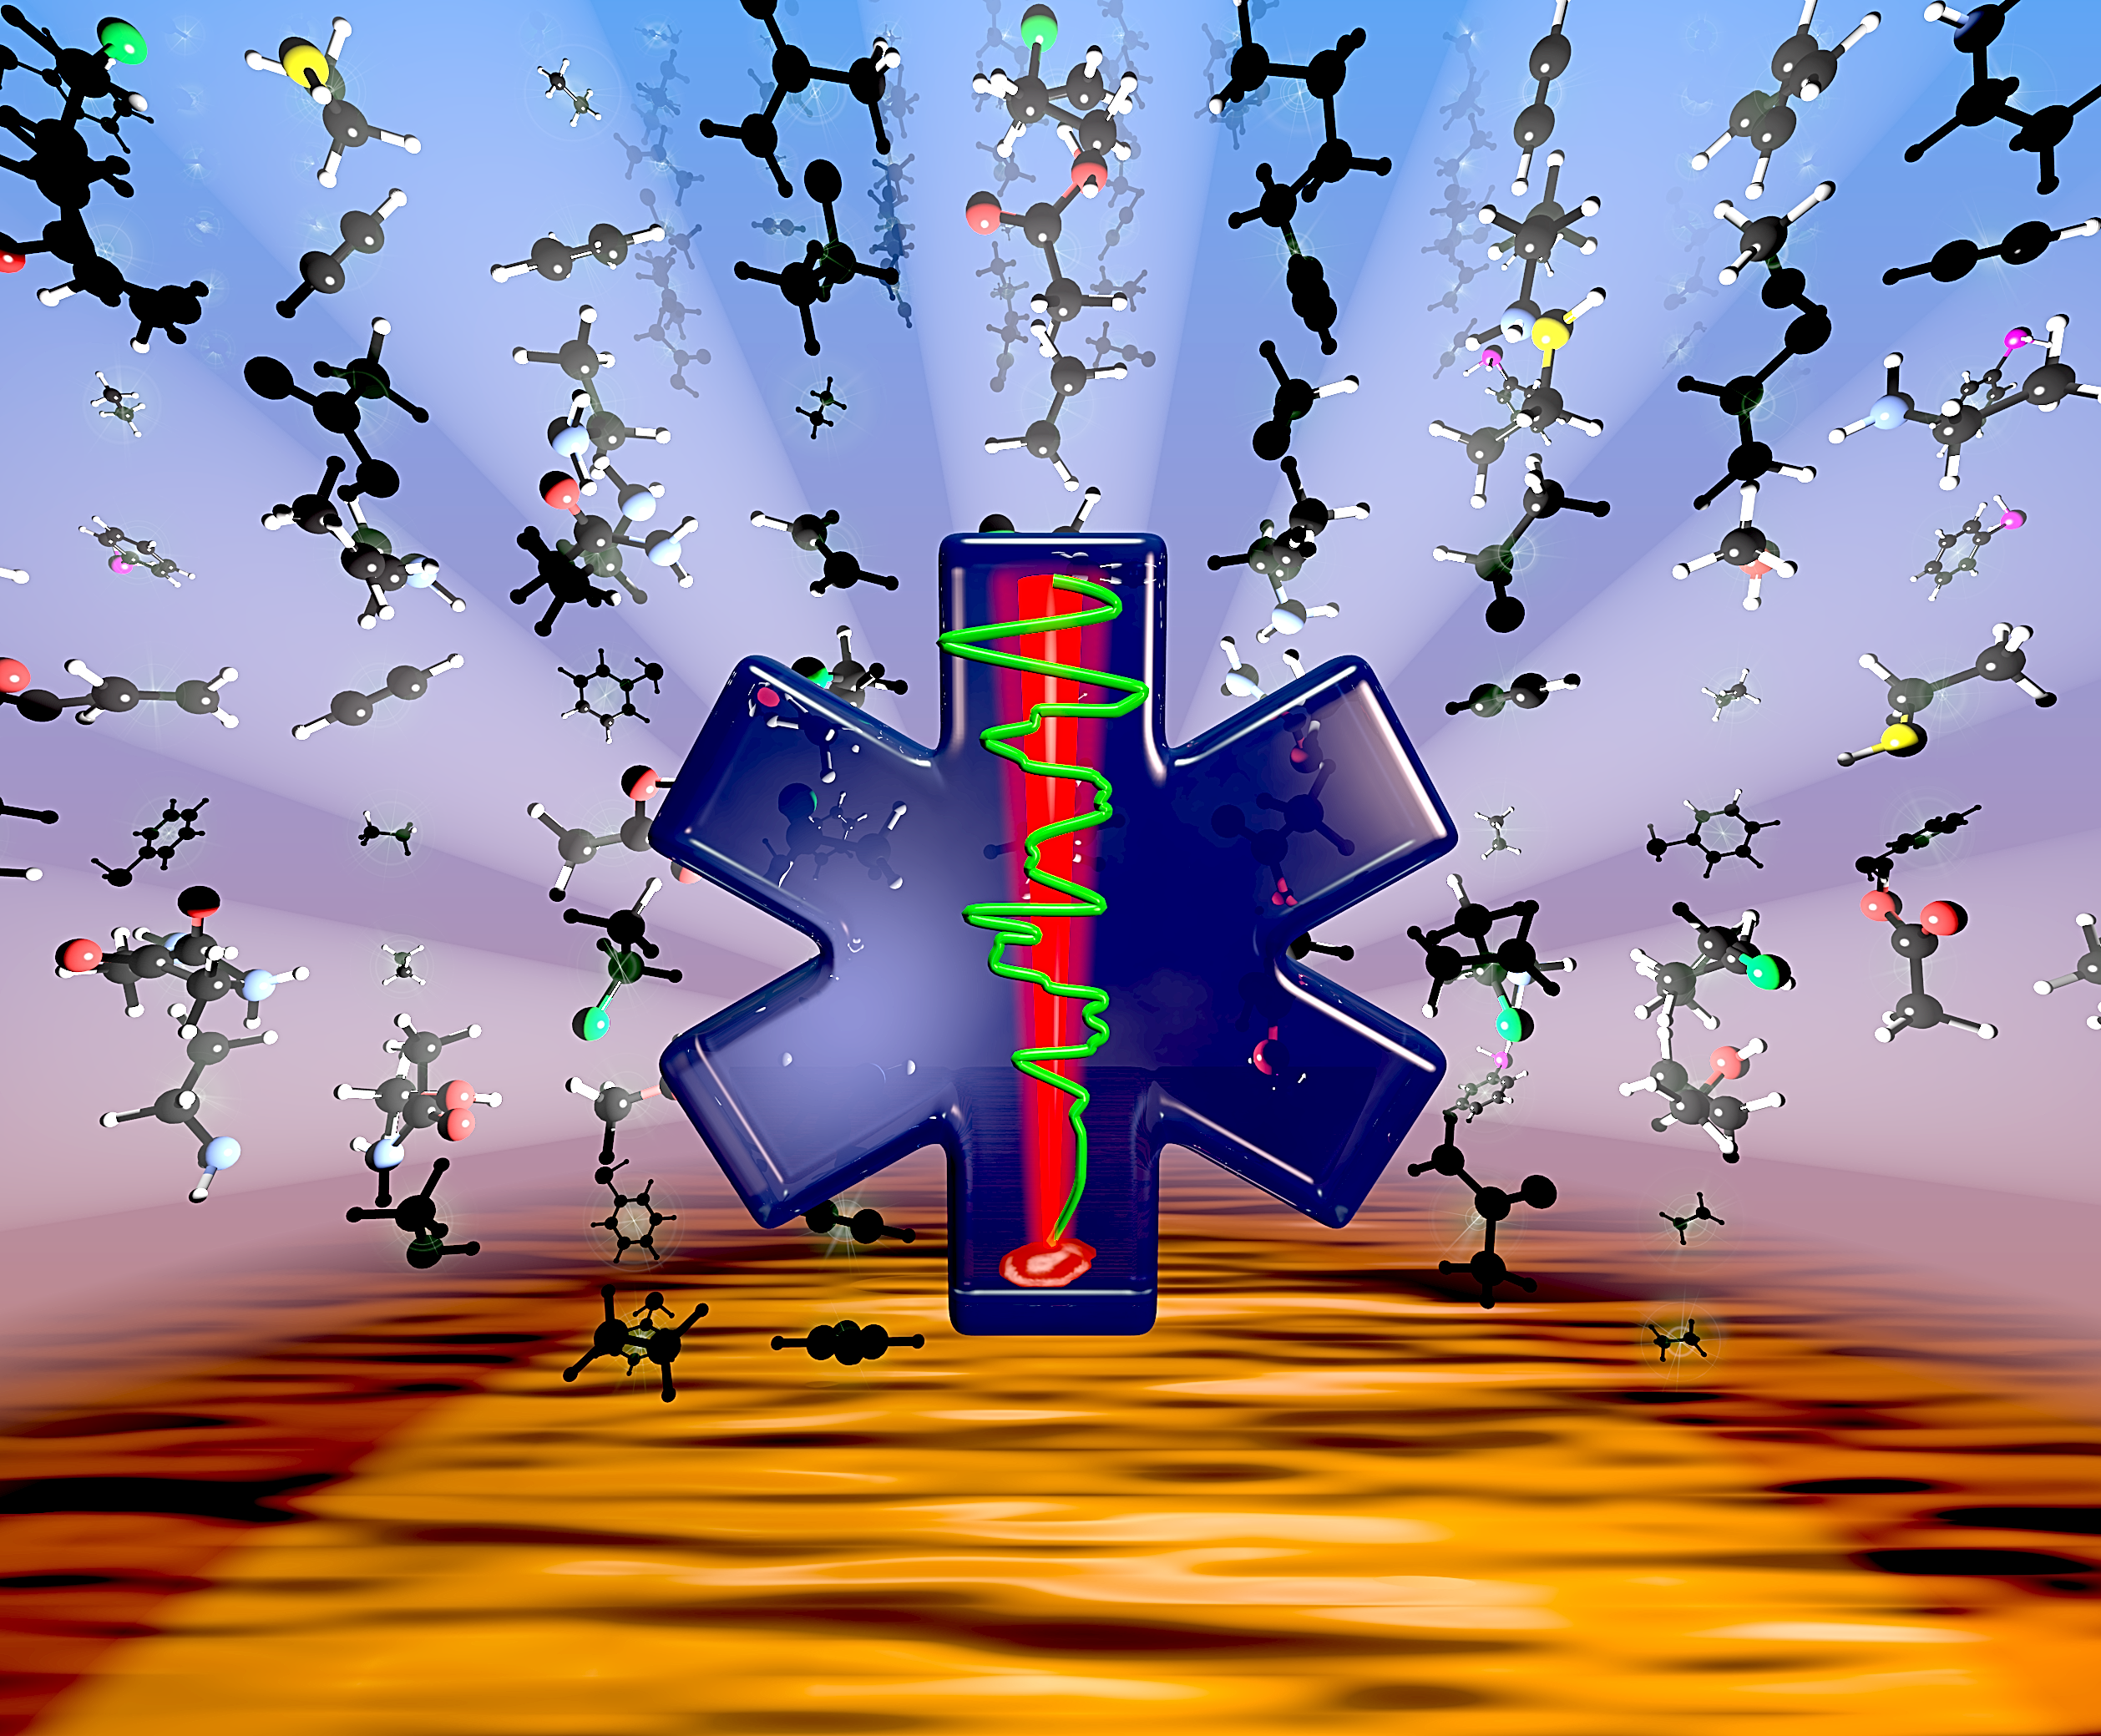 Images © Dr. Steve O’Hagan & Bioanalytical Sciences Group; copyright of journal covers is with the respective journals.

2p or not 2p: Tuppence-based SERS for the detection of illicit materials. Analyst 138, 118-122.
Analyst 138, 118-122, inside front cover: Mabbott, S., Eckman, A., Casiraghi, C. & Goodacre, R. (2013) 2p or not 2p: Tuppence-based SERS for the detection of illicit materials. Analyst 138, 118-122. Image Created using Blender and Gimp by Dr. Steve O’Hagan. 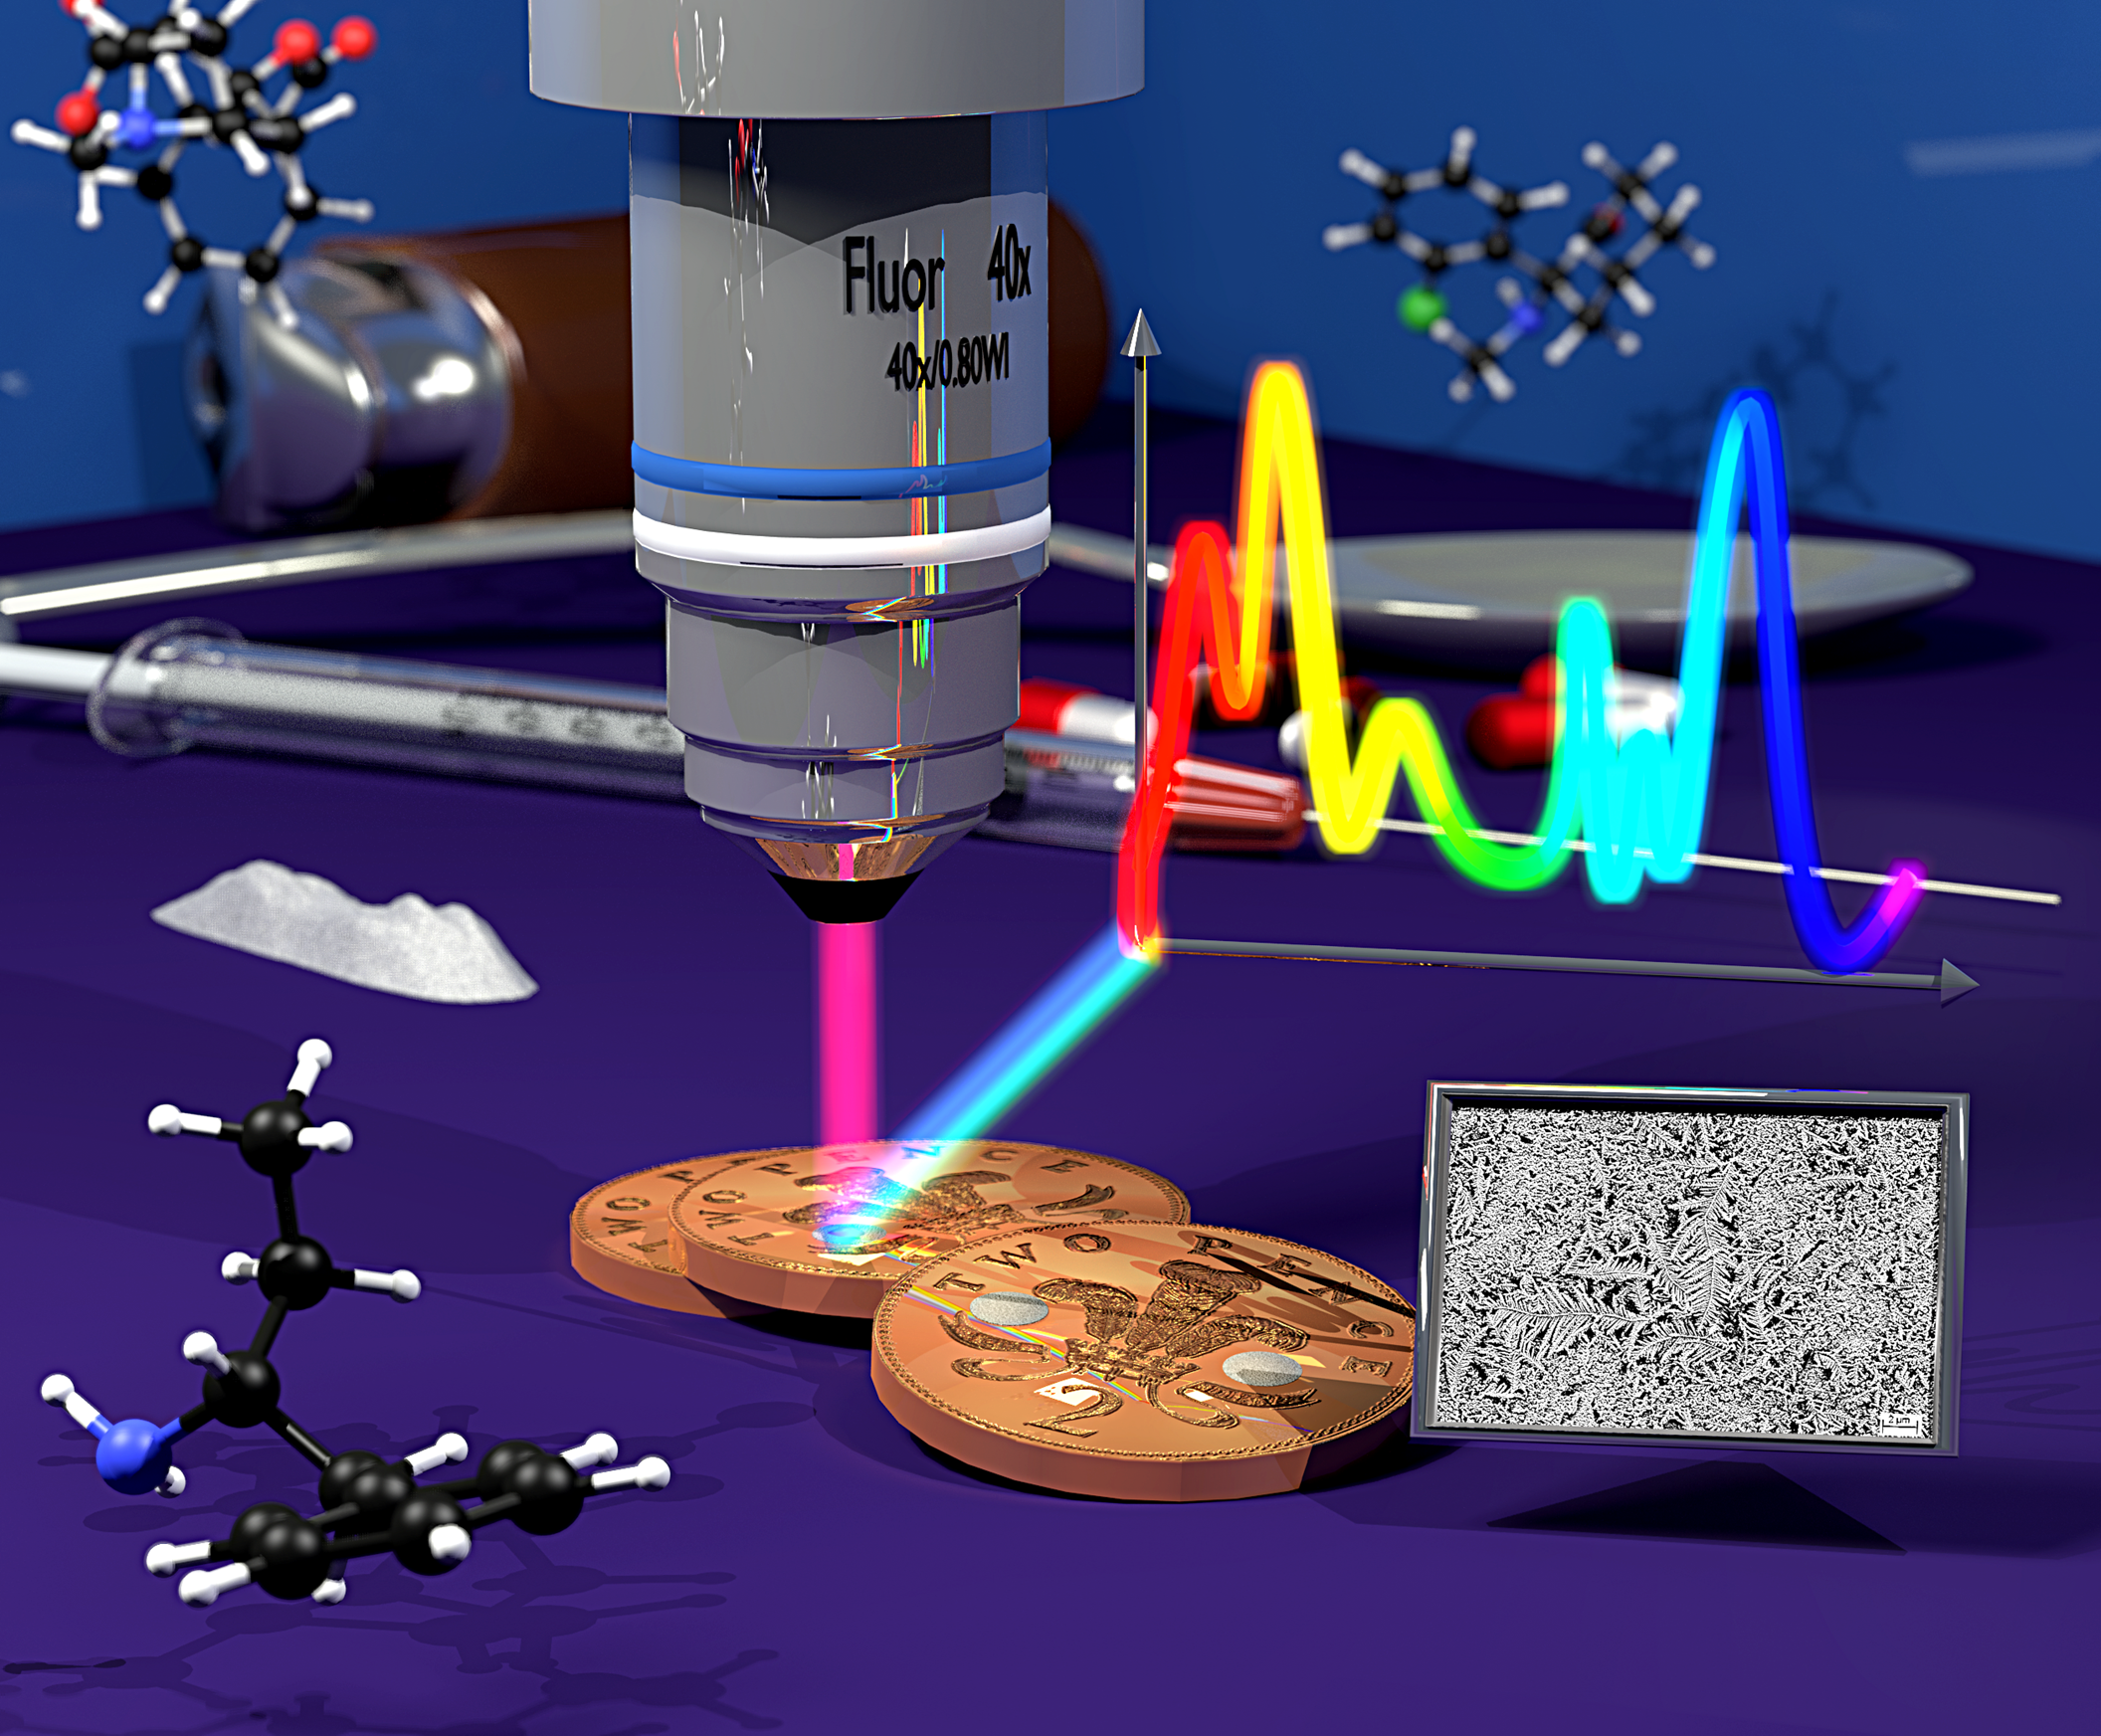 2P or not 2P – source image. Images © Dr. Steve O’Hagan & Bioanalytical Sciences Group; copyright of journal covers is with the respective journals.

Fingerprinting food: current technologies for the detection of food adulteration and contamination
D. I. Ellis, V. L. Brewster, W. B. Dunn, J. W. Allwood, A. P. Golovanov & R. Goodacre, Chem. Soc. Rev., 2012,41, 5706-5727
Fingerprinting food: current technologies for the detection of food adulteration and contamination Chem. Soc. Rev., 2012,41, 5706-5727, Inside Front Cover, Fingerprinting food: current technologies for the detection of food adulteration and contamination: D.I. Ellis, V.L. Brewster, W.B. Dunn, J.W. Allwood, A.P. Golovanov and R. Goodacre, Chem. Soc. Rev., 2012,41, 5706-5727. Image Created using Blender and Gimp by Dr. Steve O’Hagan.

Images © Dr. Steve O’Hagan & Bioanalytical Sciences Group; copyright of journal covers is with the respective journals.
Originally created for the main chemistry website, this animation illustrates “Walking Molecules”: Professor David Leigh’s group have made the first synthetic molecules that move directionally along molecular tracks.
Animation created using Blender and ChemSketch. Soundtrack courtesy of “Setuniman” at freesounds.org. (Creative Commons)
Animation © Dr. Steve O’Hagan, Bioanalytical Sciences Group & School of Chemistry; Soundtrack: Creative Commons.
[/tab][/tabs]